Speedtest Insights™
Visualize network performance, signal, QoE, tower data, and more within a user-friendly portal
With billions of daily crowdsourced network performance samples, Ookla offers an unparalleled view of global network performance. Speedtest Insights surfaces these diverse and holistic datasets across QoS, QoE, and tower data to help you visualize connectivity on an intuitive map and make smarter, faster planning and investment decisions.

See connectivity trends in the areas that matter most

Leverage an easy-to-use mapping interface to quickly understand connectivity at a high level or pinpoint precise areas of need

Analyze real-world network performance data drawn from millions of consumer-initiated tests taken everyday with Speedtest®

View Quality of Experience (QoE) data drawn from billions of daily samples for common use cases like web browsing, video streaming, gaming, and more

Access the U.S. tower industry’s most comprehensive vertical asset database including towers, buildings, utilities, DAS/small cells, signs, and properties
One easy-to-use portal with multiple datasets
With Speedtest Insights, no GIS skills are required to make informed decisions. View and compare multiple datasets on an intuitive map-based platform:
- Mobile and Fixed Performance
- Signal Strength & Quality
- Quality of Experience (QoE)
- Estimated Cell Locations
- Vertical Assets
- Boundaries
- Points of Interest
- Uploaded Data

Combine multiple layers of data for deeper insights

Add multiple layers of data to the map including performance, signal, and cell locations data to understand connectivity trends over time.

View aggregated data themed by color within administrative boundaries or other geographic areas such as counties, states/provinces, nations, U.S. census tracts, and more.
Customizable views and helpful features

- Set key range titles as “text” (excellent, good, fair, poor) or “numeric”
- Display data as binned or gradients
- View the map in 2D or 3D
- Change the map style to light, dark, streets, terrain, or satellite
- Track how metrics change over time with line charts
- Upload point data as .csv files and polygon data as .shp files to visualize your own datasets

- View performance across boundaries with metric summaries themed by color
- Draw a shape or select a boundary to search
- Search for an address, city, latitude and longitude coordinates, and more
- Summarize data within a shape or boundary
- Analyze data faster with Quick Start Dashboards
Streamline connectivity planning and investment
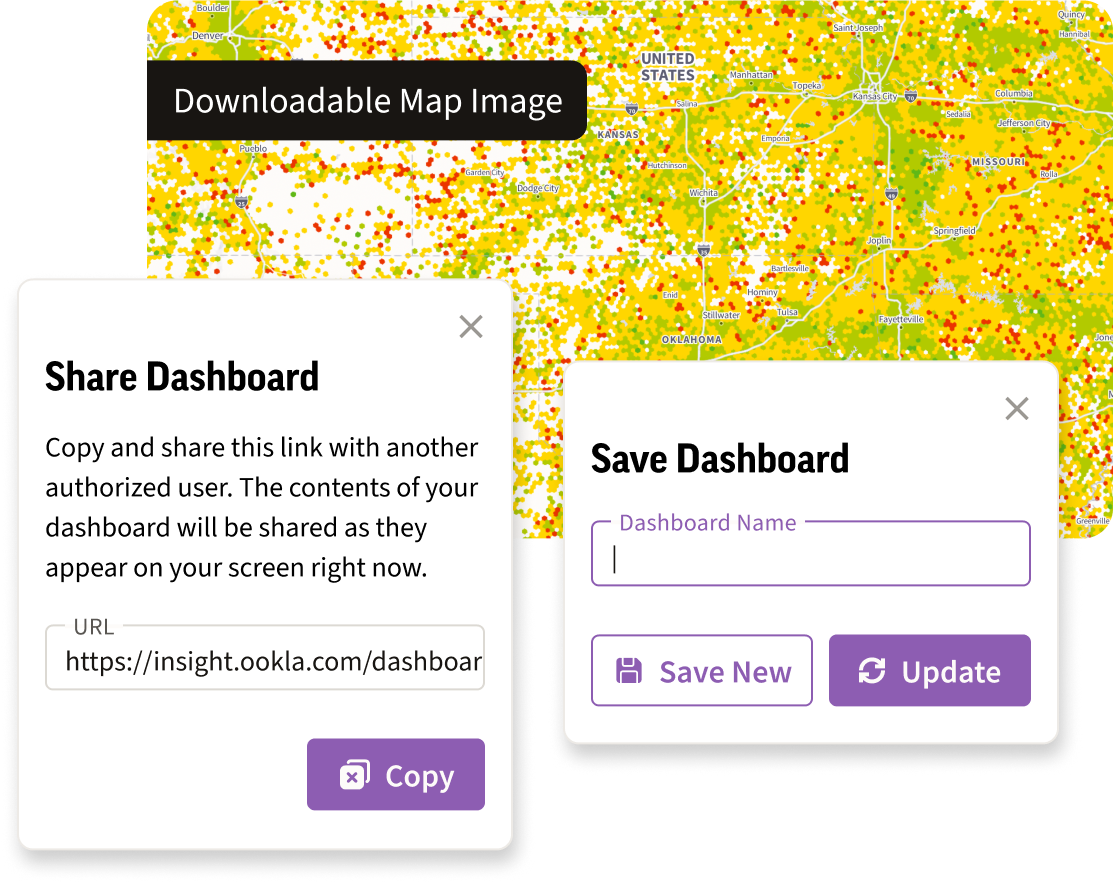
- Monitor progress over time by creating and saving custom dashboards that showcase the networks and locations you care about
- Share dashboards with other authorized users via a shareable URL
- Easily download map images to include in reports, proposals, and internal communications
Get started with Speedtest Insights
Please complete the below form to request more information about Speedtest Insights. For customer support or other inquiries, please contact us here.